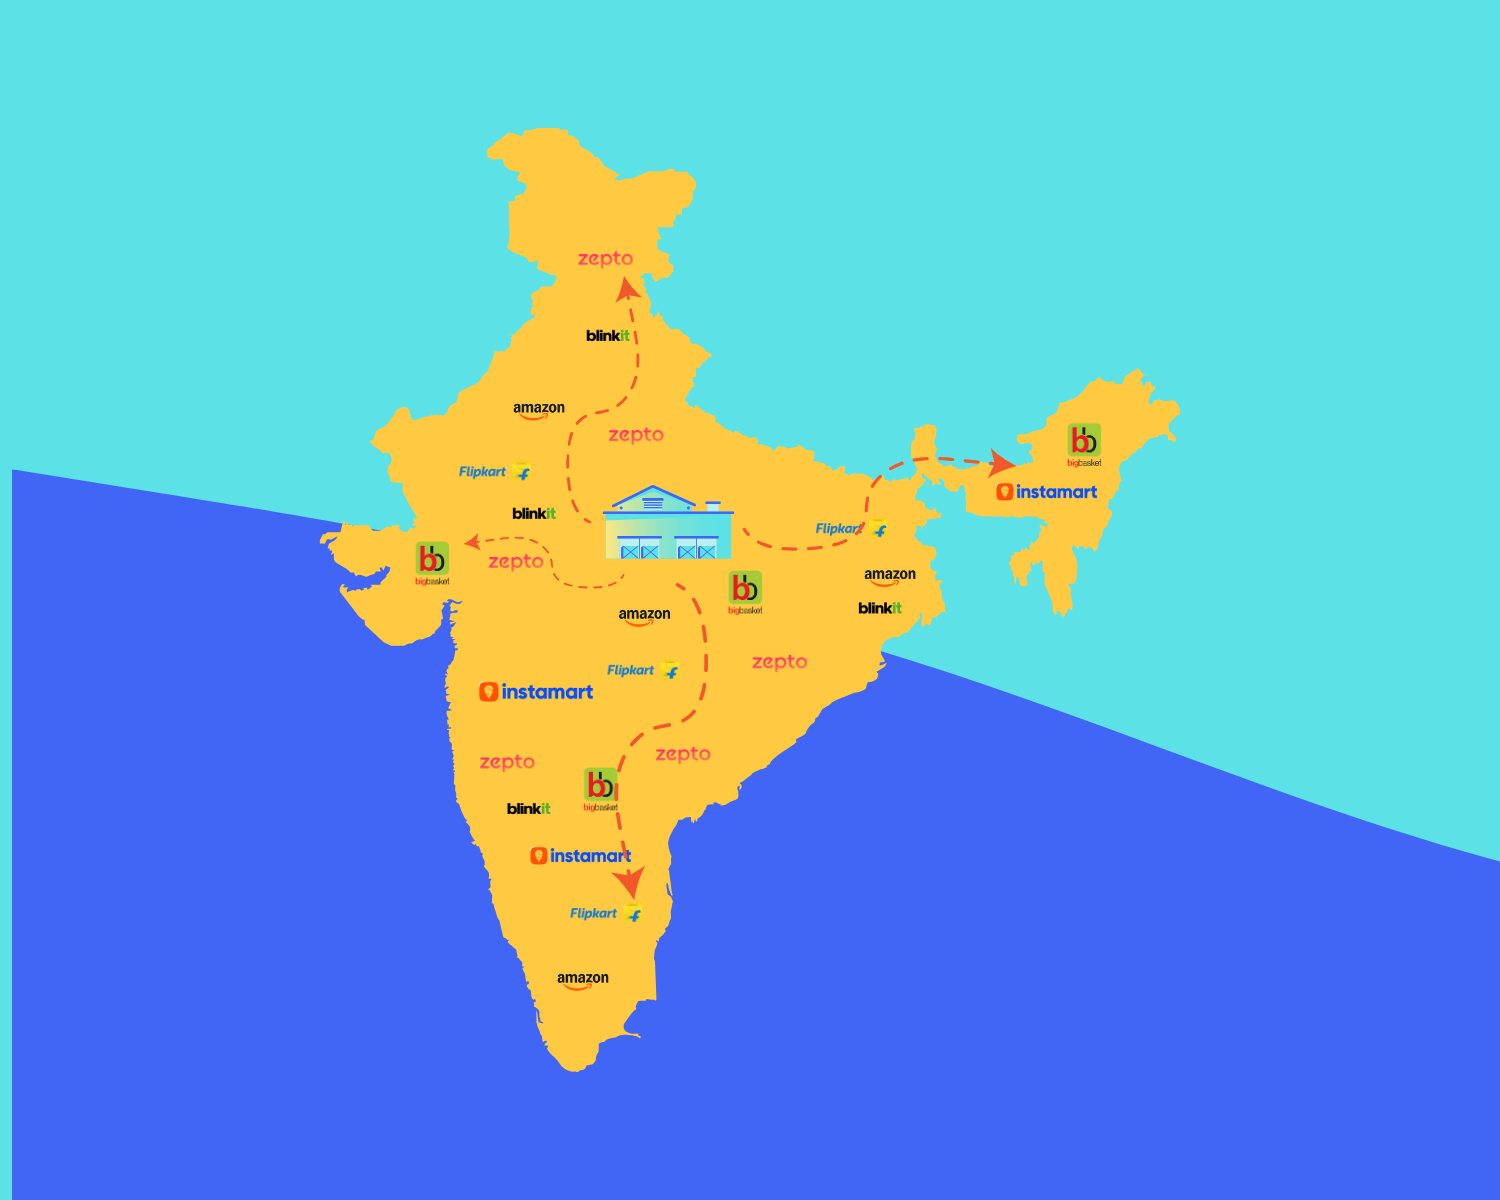
Phase 1: Know Your Playing Field
What you're doing: Figuring out if this is even worth it.
Start with the category size. Let's say the FMCG snacks market is ₹10,000 Cr. MT takes 30% of that = ₹3,000 Cr.
Your Year 1 goal? Maybe 2% share = ₹60 Cr target.
Look at competitors. Competitor A does ₹50 Cr/year across 500 stores. That's ₹83,333 per store per month. You're new, so aim for ₹10,000/store/month at launch. Scale to ₹50,000/store/month if things work.
Output: A one-page market sizing doc with your revenue target.
Phase 2: Build the Real P&L
What you're doing: Creating a financial model that won't lie to you.
MT isn't just "sell product, make money." There are layers.
Year 1 example:
100 stores
₹10,000/store/month in sales
Annual revenue = ₹1.2 Cr
But here's where ₹100 MRP actually goes:
Retailer takes ₹35
Distributor takes ₹10
Schemes cost ₹12
Logistics eat ₹5
Returns take ₹3
You get ₹35
If your manufacturing cost is ₹25, your gross margin is just ₹10. That's 10%.
This is the reality. Plan for it.
Output: A 3-year P&L that assumes things will go wrong.
Phase 3: Get on the Shelf
What you're doing: Paying to play, then making sure you actually play.
Listing fees are real. National chains charge ₹25,000/store. For 100 stores, that's ₹25 L upfront. Regional chains? Up to ₹1 L per SKU.
Distributor economics matter. Here's the math:
Your ₹1.2 Cr annual sales needs ₹6.67 L in average inventory (20-day cycle)
Distributor earns 10% gross = ₹12 L
After costs, net margin is 4-5% = ₹4.8 L
ROI = 72% on paper. Reality? 40-60% with good ops.
If distributors can't make money, you won't scale.
Output: Signed contracts. A launch checklist. A distributor pitch deck that shows them the ROI.
Phase 4: Watch What Actually Happens
What you're doing: Adjusting based on real data, not hope.
Some stores will fly. Others won't. Double down on what works.
Scale-up scenario: If stores hit ₹30,000/month (instead of ₹10,000), your revenue jumps to ₹3.6 Cr. Net realization? ₹1.26 Cr.
That's the difference between surviving and thriving.
Update your projections every month for the first 6 months. Then quarterly.
Output: A live P&L that reflects reality. An expansion plan for winning geographies.
Phase 5: Nail the Operations
What you're doing: Making sure the product is always there when someone wants to buy it.
Key metrics:
Fill rate > 90%
Stock-outs < 5%
SKU productivity > ₹30,000/store/month
Scheme uplift: 150-250% vs baseline
Returns < 3%
The cost of failure: A 10% drop in fill rate = 10 lost stores per day = ₹3 L lost per month.
Operations isn't cool these days. But they're the difference between a good brand and a dead brand.
Output: A dashboard you check weekly. SOPs for monthly reviews.
Phase 6: Learn What's Actually Working
What you're doing: Killing what doesn't work. Doubling down on what does.
Launch 5 SKUs. Only 3 cross ₹30,000/store/month. Kill the bottom 2. Save costs in logistics and promotions.
Run store audits. Talk to buyers. Listen to promoters. Run consumer panels.
The market will tell you what it wants. Listen.
Output: An insight report with clear actions—SKU cuts, pricing changes, packaging tweaks.
Phase 7: Get Better Economics
What you're doing: Using leverage to improve margins and prepare for the next phase.
You've proven yourself. Now renegotiate.
Example: Reduce retailer margin from 35% to 32%. On ₹3.6 Cr in sales, that's ₹10.8 L back in your pocket.
Optimize logistics. Consolidate distributors. Negotiate better payment terms.
Then take everything you've learned and launch the next city—but smarter.
Output: A revised P&L. A change plan. A resource reallocation memo.
The Loop
This isn't linear. It's a cycle.
Map the opportunity
Model the money
Onboard with retailers and distributors
Scale what works
Stabilize operations
Learn from data
Optimize and repeat
MT is hard. But it's not random. The brands that win are the ones that understand the numbers, move fast, and don't lie to themselves about what's working.
![[object Object]](/_next/image?url=https%3A%2F%2Fcdn.sanity.io%2Fimages%2F15uaalow%2Fproduction%2Faea19f78138902aca049437a1b898c02fd6cefb9-1646x838.webp%3Ffit%3Dmax%26auto%3Dformat&w=3840&q=75)
